Generating diagrams from XSD files on Windows
- Context
- Download dgis/xsddiagram
- Add executable to the PATH
- Powershell script
- Execute script
- Result
- References
I always loved the Oxygen XML Editor, in particular the way it represents XML Schemas (or XSD’s) in an easy to understand, visual way. However, the price tag is very high, especially when you have to pay for it on a yearly basis.
Context
I set out to find an open-source alternative for generating diagrams from XSD files and discovered dgis/xsddiagram, an open-source GUI/CLI tool that generates diagrams from XSD files automatically. There are two catches, though:
-
It only runs on Windows since it requires the .NET framework (I will be taking a look at how to run this in a Docker Container in the future, though…)
-
It does not support exporting the diagrams to PDF Format, only to PNG. This makes it impossible to Ctrl+F to search for a particular element or attribute in the diagram! If this was UNIX, I could cook up a script to print the SVG’s to PDF, but oh well… It is a question to solve later after I get it running in the container.
Download dgis/xsddiagram
Download the program and unzip it to Program Files folder.
Add executable to the PATH
This will make it easier to work with the script below. In alternative, replace XSDDiagramConsole.exe in the script with the absolute path of the XSDDiagramConsole.exe binary.
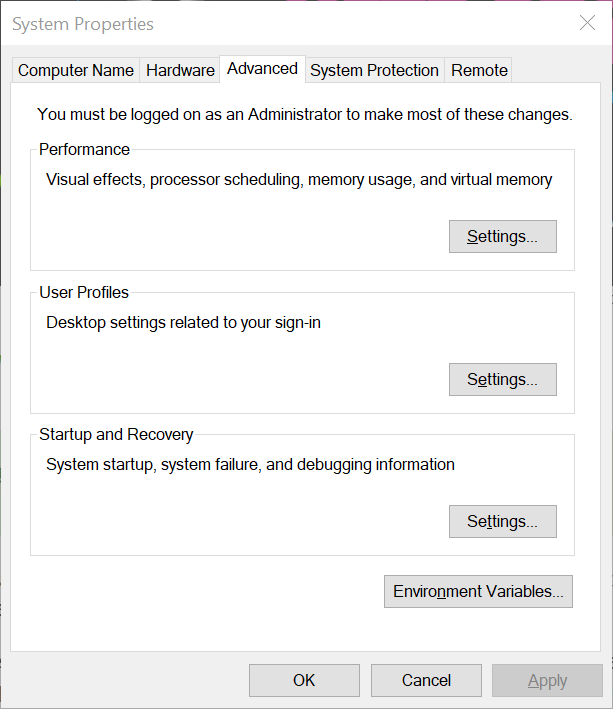
Access the System Properties, Advanced, click Environment Variables….
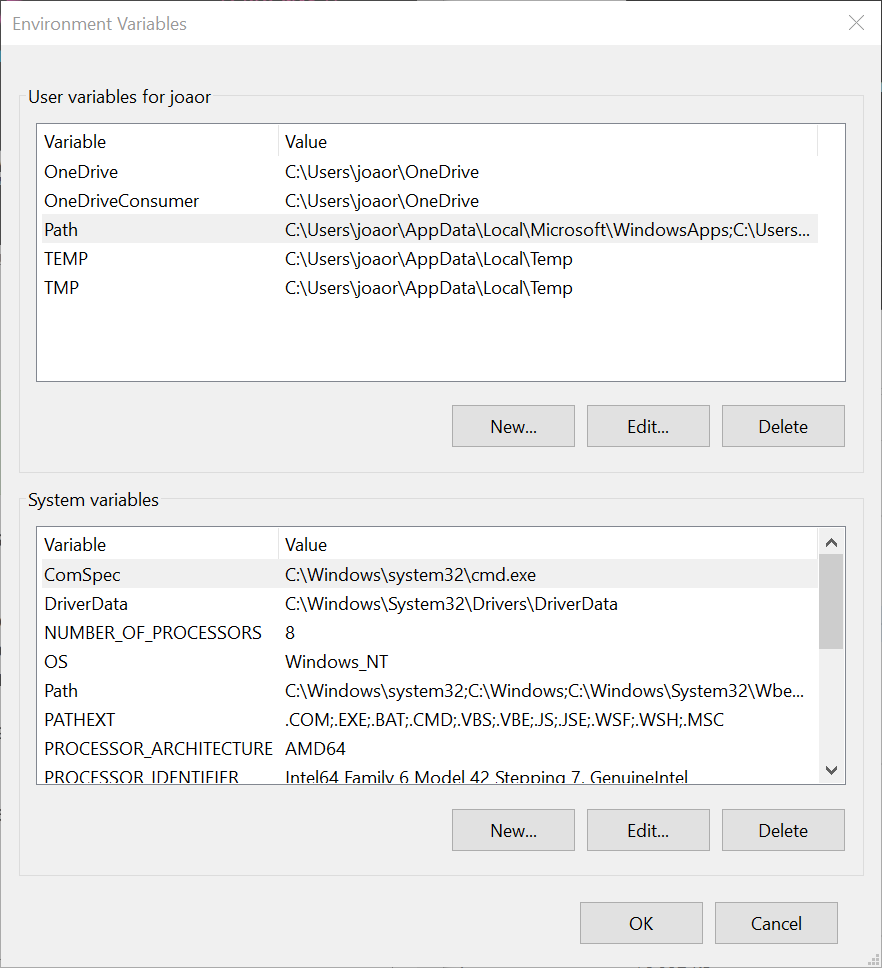
Select Path, Click Edit
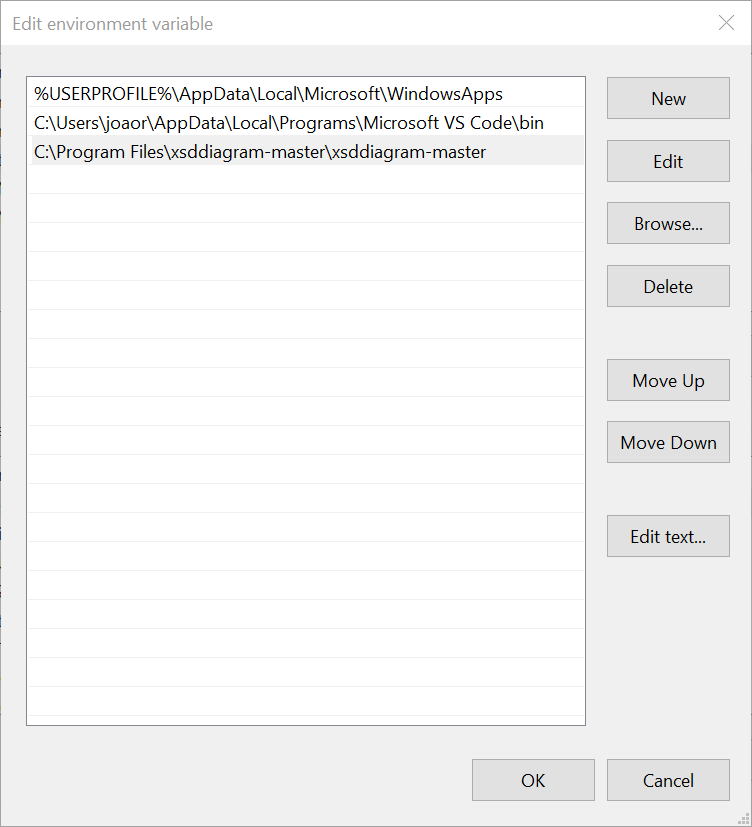
Add the path that contains XSDDiagramConsole.exe to the list
Powershell script
Copy this template script and save it in a file named make_diagrams.ps1 it in the same folder as your XSDs. You will need to edit the some of the noted parameters with !! to match your needs.
1
2
3
4
5
6
7
8
9
10
11
12
13
14
15
16
17
18
19
20
21
22
23
24
25
26
27
28
29
# !! You can change the Filter to
# !! retrieve only the files that you
# !! want to represent as diagrams
Get-ChildItem . -Filter SomeFilterForStartOfFileName*.xsd |
Foreach-Object {
	$filename = $_.FullName

	# Change extension if you need a .png, .jpg...
	# I used svg since it is a vector format and
	# thus allows Search in the diagram to find certain
	# elements.
    $output_file = $_.FullName + ".svg"

	# !! Edit the RootElement to match
	# !! the root element of your XSDs.
	#
	# -e 10000 will expand at most 10000
	# levels of #elements, which
	# in practice generates a diagram
	# of the entire XSD.
	#
	# If you did not add the xsddiagram
	# folder (containing the
	# XSDDiagramConsole.exe binary)
	# to the PATH, replace
	# XSDDiagramConsole.exe with
	# the absolute path
    XSDDiagramConsole.exe -r RootElement -o $output_file -e 10000 $filename
}
Execute script
Start a PowerShell Terminal as Administrator. You will need this to temporarily enable execution of PowerShell scripts.
1
2
3
4
5
6
7
8
# get the current policy (on a clean Windows 10 install, you should get "Restricted")
Get-ExecutionPolicy -ExecutionPolicy

# Change the execution policy to Unrestricted (temporarily)
Set-ExecutionPolicy -ExecutionPolicy Unrestricted

# Execute the script to generate the diagrams
./make_diagrams.ps1
You can copy and paste the script snippet to generate diagrams for multiple groups of XSDs, where the root element is different, for example.
Result
Try it out. Let’s get an example XSD from (Source: W3C Tutorials) and map it to a diagram:
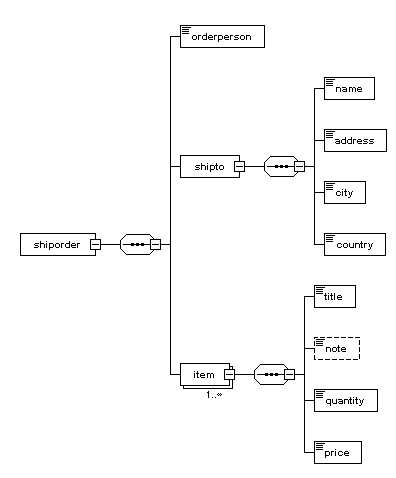
Example XSD:
1
2
3
4
5
6
7
8
9
10
11
12
13
14
15
16
17
18
19
20
21
22
23
24
25
26
27
28
29
30
31
32
33
34
35
36
37
38
39
40
41
42
43
44
45
46
47
48
49
50
51
<?xml version="1.0" encoding="UTF-8" ?>
<xs:schema xmlns:xs="http://www.w3.org/2001/XMLSchema">

<xs:simpleType name="stringtype">
  <xs:restriction base="xs:string"/>
</xs:simpleType>

<xs:simpleType name="inttype">
  <xs:restriction base="xs:positiveInteger"/>
</xs:simpleType>

<xs:simpleType name="dectype">
  <xs:restriction base="xs:decimal"/>
</xs:simpleType>

<xs:simpleType name="orderidtype">
  <xs:restriction base="xs:string">
    <xs:pattern value="[0-9]{6}"/>
  </xs:restriction>
</xs:simpleType>

<xs:complexType name="shiptotype">
  <xs:sequence>
    <xs:element name="name" type="stringtype"/>
    <xs:element name="address" type="stringtype"/>
    <xs:element name="city" type="stringtype"/>
    <xs:element name="country" type="stringtype"/>
  </xs:sequence>
</xs:complexType>

<xs:complexType name="itemtype">
  <xs:sequence>
    <xs:element name="title" type="stringtype"/>
    <xs:element name="note" type="stringtype" minOccurs="0"/>
    <xs:element name="quantity" type="inttype"/>
    <xs:element name="price" type="dectype"/>
  </xs:sequence>
</xs:complexType>

<xs:complexType name="shipordertype">
  <xs:sequence>
    <xs:element name="orderperson" type="stringtype"/>
    <xs:element name="shipto" type="shiptotype"/>
    <xs:element name="item" maxOccurs="unbounded" type="itemtype"/>
  </xs:sequence>
  <xs:attribute name="orderid" type="orderidtype" use="required"/>
</xs:complexType>

<xs:element name="shiporder" type="shipordertype"/>

</xs:schema>
(Source: W3C)
References
dgis/xsddiagram on GitHub
Comments
Post comment