3287% performance boost with 1 line of code? The impact of indexes in PostgreSQL performance!
- Tutorial contents
- Set up a custom configuration file for PostgreSQL
- Enable statistics extension using the
psqlcommand line - Set up PgAdmin connection
- Add some dummy records to the database for testing
- Running a query with EXPLAIN
- Different index types for different queries
- Measuring overall impact of a query
- Results
Slow queries are usually easy to identify, since they take at least seconds or minutes to run. Here I show a different type of optimization procedure for queries that are not expensive when ran once or twice, but that can really take a toll on a system if ran many times. We need to determine the total cost of these small queries so that we can optimize them.
Tutorial contents
Here I will use PostgreSQL, by following these steps:
- Set up a custom
postgresql.confconfiguration file to enable the necessary statistics extension - Boot up a PostgreSQL Docker container
- Enable the statistics extension using the command line
- Add some dummy records to the database
- Measuring overall impact of a query in the system
- The credits for what can arguably be considered the “the best query in the world” go to Hans-Jurgen Schonig.
- Analyse results
- Spot expensive operations and design the appropriate indices to speed up the queries
- Results analysis
We will be using Docker and Docker Compose for this example, so please install it if you did not do so already.
Set up a custom configuration file for PostgreSQL
- Place this customized postgresql.conf file in a directory of your choice.
- These two options at the end of the file are the primary changes:
1
2
3
4
5
# Add settings for extensions here
shared_preload_libraries = 'pg_stat_statements'               # (change requires restart)
pg_stat_statements.track = all
# enable tracking of time spent by the Operating System in I/O operations
track_io_timing = on
- Place this example docker-compose.yml file in the same directory. It includes some comments to explain what each line does.
- Start the containers:
docker-compose up -d
Enable statistics extension using the psql command line
1
 psql -U postgres -h localhost test
The CLI will prompt you for a password, use root as specified in the docker-compose.yml file.
1
2
CREATE EXTENSION IF NOT EXISTS pg_stat_statements;
CREATE EXTENSION IF NOT EXISTS "uuid-ossp";
Validate that the pg_stat_statements extension is active
1
2
SELECT count(*)
from pg_stat_statements;
1
2
3
4
 count
-------
     27
(1 row)
A count of 1 and no errors means that the extension is enabled.
Restart the containers
1
docker-compose restart
Set up PgAdmin connection
Access PgAdmin at http://localhost:5051 and connect to the testpostgres database. Select “Servers” at the left explorer tree, Right Click → Create → Server… and then follow these steps:
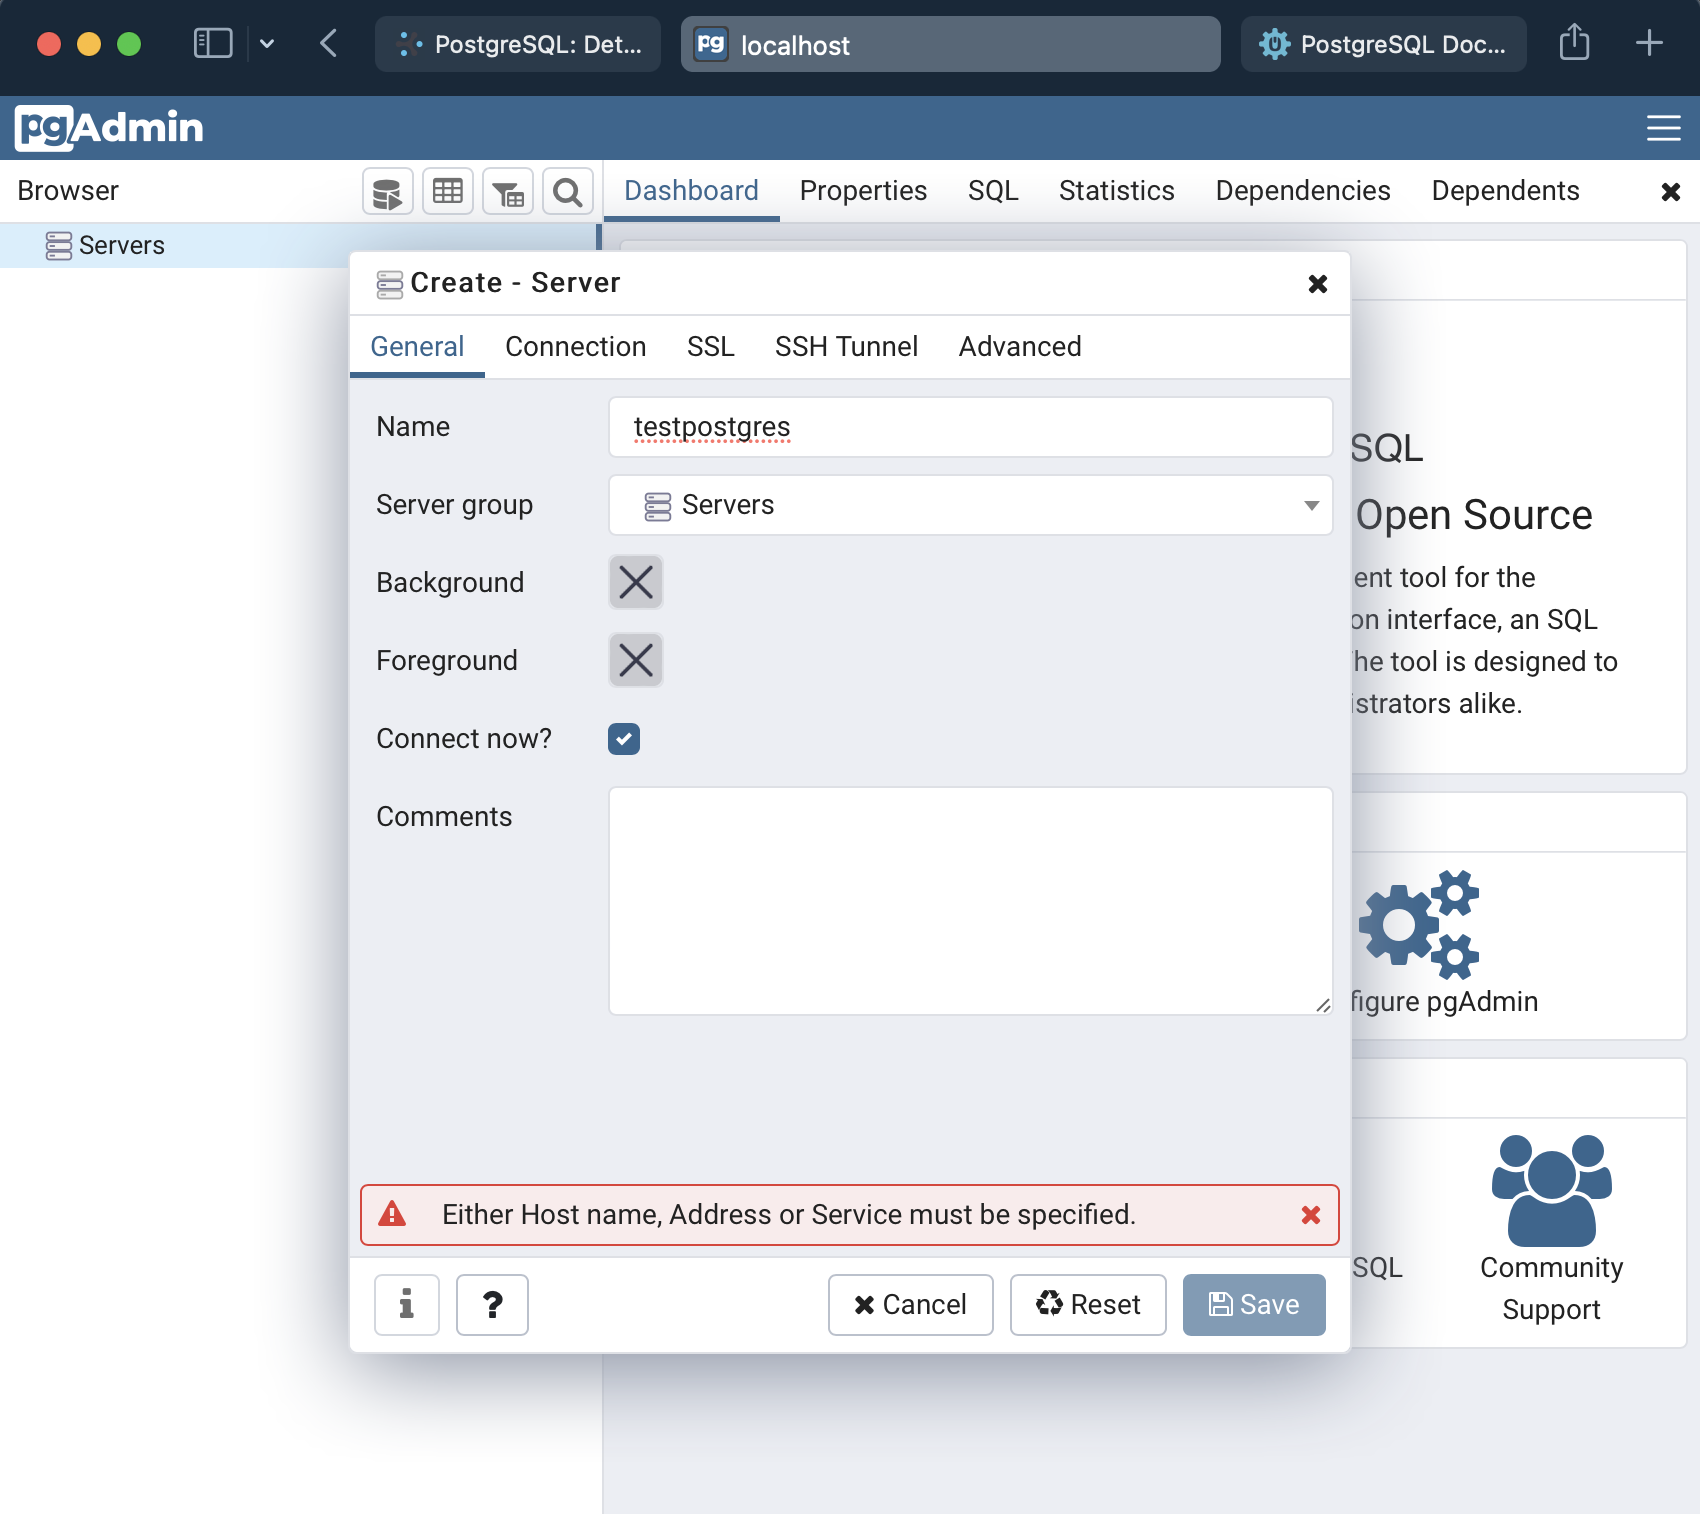
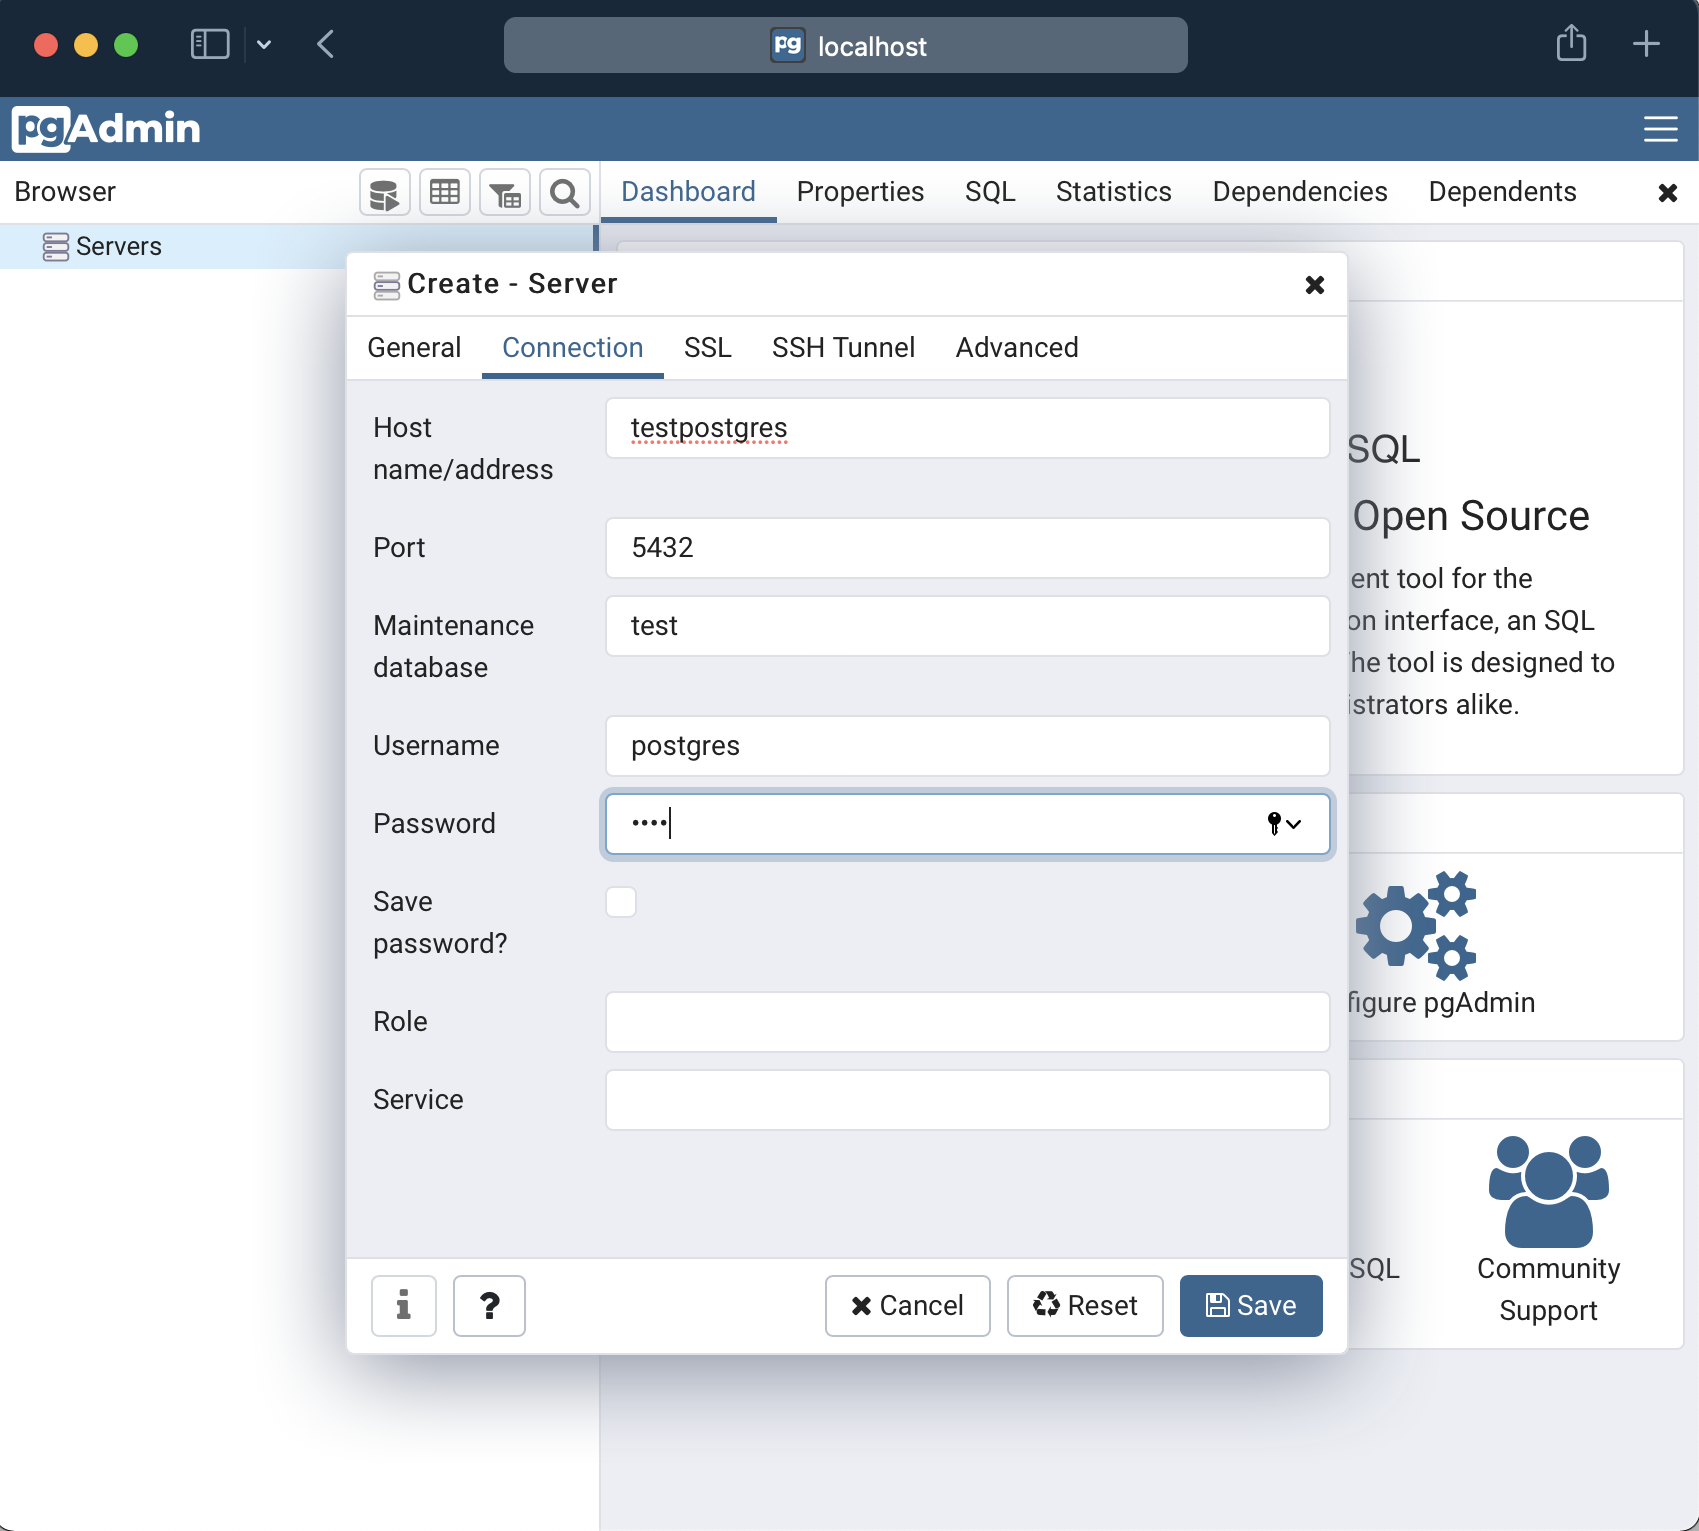
The default credentials are, according to the docker-compose.ymlfile:
- user: admin@test.com
- password: admin
Add some dummy records to the database for testing
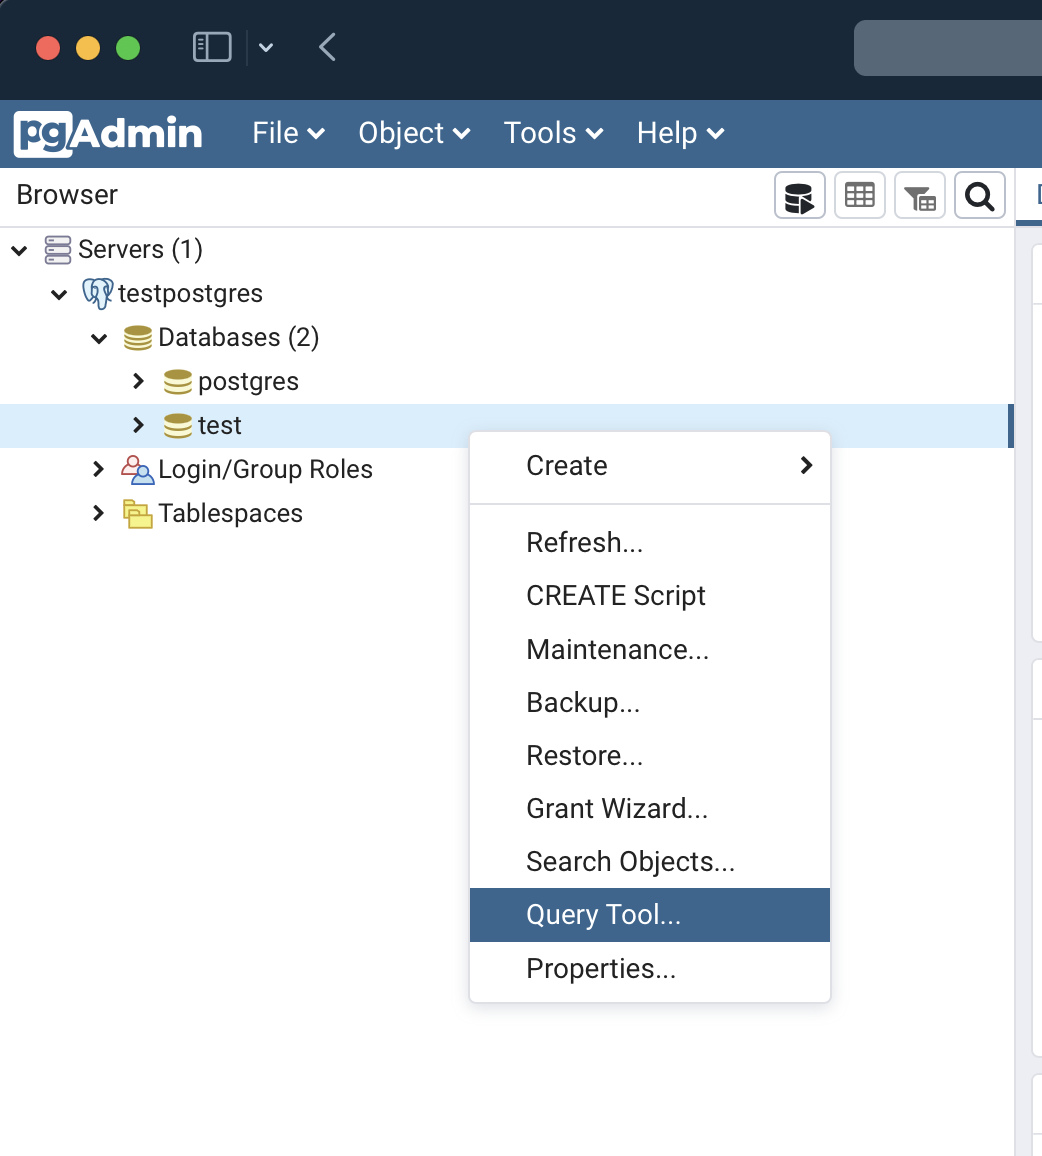
Let’s now start a new SQL Query Tool, add a very simple schema:
Import the database schema
-
Download this sql schema file.
-
Import the SQL into the database
1
psql -U postgres -h localhost test < schema-dump.sql
Password:
root -
If you ever need to dump the database, run:
1
pg_dump -U postgres -h localhost --create test > test_dump.sql
Add dummy data
Copy and paste this code in the SQL Query Tool. At the bottom there is a command to insert a certain number of random records into the database. Feel free to adjust for more or less records.
1
2
3
4
5
6
7
8
9
10
11
12
13
14
15
16
17
18
19
20
21
22
23
24
25
26
27
28
29
30
31
32
33
34
35
36
37
38
39
40
41
42
43
44
45
46
47
48
49
50
51
52
53
54
55
56
57
58
59
60
61
62
63
64
65
66
67
68
69
70
71
72
73
74
75
76
77
78
-- activate extension for generating uuids
CREATE EXTENSION IF NOT EXISTS "uuid-ossp";

-- generate a random date
create or replace function random_date() returns date
    language plpgsql
    as $$
  declare
    generatedDate       date;
  begin
  	generatedDate := (
		select NOW() + (random() * (NOW()+'90 days' - NOW())) + '30 days'
	);
    return generatedDate;
  end;
$$;

-- generate lorem ipsum random strings
-- from https://stackoverflow.com/questions/35068285/how-to-create-a-huge-string-in-postgresql/43743174
create or replace function lipsum( quantity_ integer ) returns character varying
    language plpgsql
    as $$
  declare
    words_       text[];
    returnValue_ text := '';
    random_      integer;
    ind_         integer;
  begin
  words_ := array['lorem', 'ipsum', 'dolor', 'sit', 'amet', 'consectetur', 'adipiscing', 'elit', 'a', 'ac', 'accumsan', 'ad', 'aenean', 'aliquam', 'aliquet', 'ante', 'aptent', 'arcu', 'at', 'auctor', 'augue', 'bibendum', 'blandit', 'class', 'commodo', 'condimentum', 'congue', 'consequat', 'conubia', 'convallis', 'cras', 'cubilia', 'cum', 'curabitur', 'curae', 'cursus', 'dapibus', 'diam', 'dictum', 'dictumst', 'dignissim', 'dis', 'donec', 'dui', 'duis', 'egestas', 'eget', 'eleifend', 'elementum', 'enim', 'erat', 'eros', 'est', 'et', 'etiam', 'eu', 'euismod', 'facilisi', 'facilisis', 'fames', 'faucibus', 'felis', 'fermentum', 'feugiat', 'fringilla', 'fusce', 'gravida', 'habitant', 'habitasse', 'hac', 'hendrerit', 'himenaeos', 'iaculis', 'id', 'imperdiet', 'in', 'inceptos', 'integer', 'interdum', 'justo', 'lacinia', 'lacus', 'laoreet', 'lectus', 'leo', 'libero', 'ligula', 'litora', 'lobortis', 'luctus', 'maecenas', 'magna', 'magnis', 'malesuada', 'massa', 'mattis', 'mauris', 'metus', 'mi', 'molestie', 'mollis', 'montes', 'morbi', 'mus', 'nam', 'nascetur', 'natoque', 'nec', 'neque', 'netus', 'nibh', 'nisi', 'nisl', 'non', 'nostra', 'nulla', 'nullam', 'nunc', 'odio', 'orci', 'ornare', 'parturient', 'pellentesque', 'penatibus', 'per', 'pharetra', 'phasellus', 'placerat', 'platea', 'porta', 'porttitor', 'posuere', 'potenti', 'praesent', 'pretium', 'primis', 'proin', 'pulvinar', 'purus', 'quam', 'quis', 'quisque', 'rhoncus', 'ridiculus', 'risus', 'rutrum', 'sagittis', 'sapien', 'scelerisque', 'sed', 'sem', 'semper', 'senectus', 'sociis', 'sociosqu', 'sodales', 'sollicitudin', 'suscipit', 'suspendisse', 'taciti', 'tellus', 'tempor', 'tempus', 'tincidunt', 'torquent', 'tortor', 'tristique', 'turpis', 'ullamcorper', 'ultrices', 'ultricies', 'urna', 'ut', 'varius', 'vehicula', 'vel', 'velit', 'venenatis', 'vestibulum', 'vitae', 'vivamus', 'viverra', 'volutpat', 'vulputate'];
    for ind_ in 1 .. quantity_ loop
      ind_ := ( random() * ( array_upper( words_, 1 ) - 1 ) )::integer + 1;
      returnValue_ := returnValue_ || ' ' || words_[ind_];
    end loop;
    return returnValue_;
  end;
$$;

-- insert a recordCount number of records into the orders and clients tables
create or replace procedure insert_random_records( recordCount integer )
language plpgsql
as $$
declare
    client_id uuid;
begin
for r in 1..recordCount
loop
	client_id := (
		select uuid_generate_v4()
	);

	insert into public.clients(id, name, dob)
	values(
		client_id
		,
		(
			select lipsum(10)
		),
		(
			select random_date()
		)
	);

	insert into public.orders(id, client_id, created)
	values(
		uuid_generate_v4()
		,
		client_id,
		(
			select random_date()
		)
	);
end loop;
end;
$$;

-- add a certain number of generated records (1 client + 1 order each)
call insert_random_records(50000);
Running a query with EXPLAIN
The EXPLAIN command allows you to view the query plan designed by the DBMS, and determine if it will be efficient or not, and identify potential needs for indexes.
1
2
3
4
5
6
7
8
explain
select *
from orders
where created
between
	(CURRENT_DATE - INTERVAL '10 days')
	and
	(CURRENT_DATE + INTERVAL '10 days');
1
2
3
4
                                                     QUERY PLAN
---------------------------------------------------------------------------------------------------------------------
 Seq Scan on orders  (cost=0.00..1700.00 rows=1 width=36)
   Filter: ((created >= (CURRENT_DATE - '10 days'::interval)) AND (created <= (CURRENT_DATE + '10 days'::interval)))
Notice that here we have a sequential scan (i.e. a complete loop) on the orders table. This is very expensive (between 0 and 1700.00 cost units), so let’s add some indexes.
Different index types for different queries
As a rule of thumb:
- If you have queries for exact matches (
=operator) , ahashindex should be used. - If you have queries with range criteria (
>or<-like operators), anbtreeindex should be used.
Adding an index to accelerate our query
In our query we have a range criteria on the createdfield, so let’s create a btree index on that field:
1
2
3
4
5
-- create the index
CREATE INDEX orders_created_idx ON public.orders USING btree (created DESC NULLS LAST);

-- reindex the table so that the index is updated
REINDEX TABLE orders;
Let’s take a look at the CREATE INDEX command:
using btree: Uses a BTREE index, since we are using a range comparison in our queryDESC: Useful when we want to sort our query results after retrieving them. If in descending order- For example, if your system needs to get the most recent orders first for a paged view, for example the order of the index shoud be descending as well.
NULLS LAST: optimizes the index for sorting tuples with NULL values on the target columns at the end.
Re-run the same query
1
2
3
4
5
6
7
8
explain
select *
from orders
where created
between
	(CURRENT_DATE - INTERVAL '10 days')
	and
	(CURRENT_DATE + INTERVAL '10 days');
1
2
3
4
-------------------------------------------------------------------------------------------------------------------------
 Index Scan using orders_created_idx on orders  (cost=0.30..8.32 rows=1 width=36)
   Index Cond: ((created >= (CURRENT_DATE - '10 days'::interval)) AND (created <= (CURRENT_DATE + '10 days'::interval)))
(2 rows)
Now we have a an index scan on the orders table! This is much more efficient (0.30 to 8.32 cost units vs the initial 1700).
Measuring overall impact of a query
Which queries are consuming the most CPU as a whole, i.e. (times called * time taken)?
1
2
3
4
5
6
7
8
SELECT substring(query, 1, 40) AS query,
      calls,
      round(total_time::numeric, 2) AS total_time,
      round(mean_time::numeric, 2) AS mean_time,
      round((100 * total_time / sum(total_time) OVER ())::numeric, 2) AS percentage
FROM pg_stat_statements
ORDER BY total_time DESC
LIMIT 10;
1
2
3
4
5
6
7
8
9
10
11
12
13
14
15
                  query                   | calls | total_time | mean_time | percentage
------------------------------------------+-------+------------+-----------+------------
 ALTER TABLE ONLY public.orders          +|     1 |    4786.04 |   4786.04 |      19.38
     ADD C                                |       |            |           |
 COPY public.clients (id, name, dob) FROM |     1 |    4380.50 |   4380.50 |      17.74
 ALTER TABLE ONLY public.clients         +|     1 |    4198.65 |   4198.65 |      17.00
     ADD                                  |       |            |           |
 CREATE DATABASE "test"                   |     1 |    2985.64 |   2985.64 |      12.09
 COPY public.orders (id, client_id, creat |     1 |    2461.64 |   2461.64 |       9.97
 COPY public.clients (id, name, dob) TO s |     2 |    1543.10 |    771.55 |       6.25
 COPY public.orders (id, client_id, creat |     2 |     926.27 |    463.14 |       3.75
 CREATE INDEX fki_orders_clientid_client_ |     1 |     756.58 |    756.58 |       3.06
 SELECT c.tableoid, c.oid, c.relname, (SE |     3 |     605.46 |    201.82 |       2.45
 CREATE EXTENSION IF NOT EXISTS pg_stat_s |     1 |     381.34 |    381.34 |       1.54
(10 rows)
Here we can see the most time-consuming queries so far. We only created the database, so it is not very interesting. Let’s run a quick query multiple times:
Run a query many times to update the statistic
Here we simulate the load on a server by running our query 500 times:
1
2
3
4
5
6
7
8
9
10
11
12
13
14
15
16
17
18
19
20
21
22
create or replace procedure run_simple_query_many_times( nTimes integer )
language plpgsql
as $$
declare
	pastOrders int;
begin
for r in 1..nTimes
loop
	pastOrders := (
		select count(*)
		from orders
		where created
		between
			(CURRENT_DATE - INTERVAL '10 days')
		and
			(CURRENT_DATE + INTERVAL '10 days')
	);
end loop;
end;
$$;

call run_simple_query_many_times(500);
Results
Let us use our statistics package to measure the impact of the addition of this simple index.
Running the test without the index (baseline)
1
2
3
4
5
6
7
8
9
10
11
12
13
14
test=# SELECT substring(query, 1, 40) AS query,                                                                                                                                         calls,                                                                                                                                                                            round(total_time::numeric, 2) AS total_time,                                                                                                                                      round(mean_time::numeric, 2) AS mean_time,                                                                                                                                        round((100 * total_time / sum(total_time) OVER ())::numeric, 2) AS percentage                                                                                               FROM pg_stat_statements                                                                                                                                                           ORDER BY total_time DESC                                                                                                                                                          LIMIT 10;
                  query                   | calls | total_time | mean_time | percentage
------------------------------------------+-------+------------+-----------+------------
 call run_simple_query_many_times(500)    |     1 |   64861.13 |  64861.13 |      48.87
 SELECT (                                +|   500 |   64740.01 |    129.48 |      48.78
         select count(*)                 +|       |            |           |
                                          |       |            |           |
 /*pga4dash*/                            +|    90 |    3103.17 |     34.48 |       2.34
 SELECT $1 AS chart_name, ro              |       |            |           |
 SELECT pg_stat_statements_reset()        |     1 |       7.41 |      7.41 |       0.01
 create or replace procedure run_simple_q |     2 |       6.54 |      3.27 |       0.00
(5 rows)

test=#
Notice how now, we have 1 call to our run_simple_query_many_times procedure, and 500 calls to our query. 48% of the CPU time was spent in this query, and a total of 64740 milliseconds in total were spent running the query across the 500 calls.
Resetting statistics
To reset the statistics between test runs you may use this command in a psql prompt:
1
SELECT pg_stat_statements_reset();
Running the test with the index (alternative scenario)
1
2
3
4
5
6
7
8
9
10
11
12
test=# SELECT substring(query, 1, 40) AS query,                                                                                                                                         calls,                                                                                                                                                                            round(total_time::numeric, 2) AS total_time,                                                                                                                                      round(mean_time::numeric, 2) AS mean_time,                                                                                                                                        round((100 * total_time / sum(total_time) OVER ())::numeric, 2) AS percentage                                                                                               FROM pg_stat_statements                                                                                                                                                           ORDER BY total_time DESC                                                                                                                                                          LIMIT 10;
                  query                   | calls | total_time | mean_time | percentage
------------------------------------------+-------+------------+-----------+------------
 call run_simple_query_many_times(500)    |     1 |     102.01 |    102.01 |      58.75
 /*pga4dash*/                            +|     1 |      34.29 |     34.29 |      19.75
 SELECT $1 AS chart_name, ro              |       |            |           |
 SELECT (                                +|   500 |      19.67 |      0.04 |      11.33
         select count(*)                 +|       |            |           |
                                          |       |            |           |
 SELECT pg_stat_statements_reset()        |     1 |      10.54 |     10.54 |       6.07
 create or replace procedure run_simple_q |     1 |       7.11 |      7.11 |       4.10
(5 rows)
This time, a total of just 19.67 milliseconds in total were spent running the query.
That is a performance increase of 3287%!
So, next time you write a query in your system, double check if any indexes should be updated /added as well…
Comments
Post comment